1.1. How to measure the total execution time
Total execution time is the single most important metric by which we score
geant4 and full_cms.
What should be the entry point for our profiling ?
Since we would like to skip the whole initialization part of full_cms, we
shoule trace from BeamOn() or even better from the EventManager::DoEventLoop(),
because BeamOn() calls some initialization routines itself.
We use the following script:
#!/bin/bash

set -e
set -x

benchmarks=(bench1_10.g4 bench1_100.g4 bench1_200.g4 bench1_300.g4 bench1_500.g4 bench1_1k.g4 bench1_5k.g4)

for j in {1..5};
do
    for bench in "${benchmarks[@]}";
    do
        cat /devices/pseudo/dummy@0:0
        dtrace -n '
                pid$target::*DoEventLoop*:entry                { self->pstart = vtimestamp; }
                pid$target::*DoEventLoop*:return/self->pstart/ { @ = sum((vtimestamp - self->pstart)/1000000);
                                                                 self->pstart = 0; }' -c \
                '/home/stathis/gen-tests/geant4/geant4.9.5.p01/bin/Linux-g++/full_cms ./'${bench}'' -o \
                    "res-${bench}-$j"
    done
done
1.2. How to measure the average time spent by a function
What should be the entry point for our profiling ?
As previous.
Which functions should we be profiling ?
Trying to calculate the time that each functions consumes is troublesome. DTrace matches around
40,000 probes and the execution is slowed down considerably. If that option is chosen though,
use vtimestamp instead of timestamp, so that the results are less affected by the DTrace itself.
Another, more pragmatic approach, is to identify those functions that contribute most in the overall
execution time and focus on profiling them only. This can be done by taking sample stack traces,
while full_cms is running. Then, we examine those stack traces and deduce which functions are the
"hottest" (a function that is taking a lot time to execute, is more likely to get sampled, since we
are sampling at a fixed rate).
More information can be found here. E.g.,
solaris# dtrace -x ustackframes=100                                                               \
                -x strsize=5000                                                                   \
                -n 'BEGIN { tracing = 0; }                                                        \
                    pid$target::*DoEventLoop*:entry { tracing = 1; }                              \
                    pid$target::*DoEventLoop*:return { exit(0); }                                 \
                    profile-97/tracing != 0/ { @[ustack()] = count(); }'                          \
                 -c "/home/stathis/geant4/geant4.9.5.p01/bin/Linux-g++/full_cms ./bench_10.g4"    \
                 -o out.user_stacks

|
The profile target does NOT fire in thread context, therefore using self→tracing
as a predicate will not work. Use a global variable instead. |
For 10 events the above invocation produces approximately 3MB of profiling data.
Next steps are:
-
generate the folded output with stackcollapse.pl
-
pass the output to cxxfilt to demangle the c++ symbols
-
delete the line corresponding the idle line, which looks like " 4168"
-
generate the svg file with flamegraph.pl
./stackcollapse.pl   out.user_stacks    |
/usr/gnu/bin/c++filt -n -p              |
grep DoEventLoop                        |
sed 's/full_cms`//g'                    |
./flamegraph.pl > DoEventLoop.demangled.svg
This is an example of the svg output
file, and this is with
demangled names.
Generate the targeted DTrace script
After having identified the "hot" functions, we run a shell script that generates a DTrace
script that focuses on profiling these functions only.
curl -o stacks2dtrace.sh http://leaf.dragonflybsd.org/~beket/geant4/stack2dtrace.sh
chmod +x stacks2dtrace.sh
stacks2dtrace.sh <folded.file> > test.d
Example of DTrace script:
curl -o test.d http://leaf.dragonflybsd.org/~beket/geant4/test.d
The script should be called with -Z (for not failing on unmathced probes) and with
-x dynvarsize=8m (for not dropping dynamic variables). E.g.,
solaris# ./test.d -Z -x dynvarsize=8m \
         -c "/home/stathis/gen-tests/geant4/geant4.9.5.p01/bin/Linux-g++/full_cms ./bench1_10.g4"
Example of DTrace output:
curl -o http://leaf.dragonflybsd.org/~beket/geant4/test.d.out1 \
     c++filt -n -p
|
|
g++ generates mangled symbols during the compilation. So, we use *globs* inside the DTrace script,
if we don’t want to nm(1) the executable and copy the exact (mangled) names from there. I looked
for a way to generate mangled names for g++, but their abi:: exported interface has only __cxa_demangle(). |
How many events should we be simulating ?
We let the full_cms run for 100 events and every time one such event is processed,
we print the average time spent on the "hot" functions. The idea is to see past which
event region the average times enter a steady state. We do this by enabling a probe,
like the following:
pid$target::*MyEventAction*EndOfEventAction*:entry
{
        printa(@_);
}
An example can be found here. We, then, use
a script file to extract the aggregations for
every event, and another one, to reconstruct
a time series for every "hot" function.
(echo -n 'set log y; plot '; for f in _Z*; do echo -n "'$f' notitle with lines,"; done) \
      | gnuplot -persist
(echo -n 'plot '; for f in _Z*; do echo -n "'$f' notitle smooth csplines,"; done) \
      | gnuplot -persist
2.1. Cycles per Instruction (CPI)
2.1.1. cpustat(1M) and cputrack(1)
Solaris has two utilities for examining hardware performance counters:
cpustat(1M) for overall system monitoring, and cputrack(1) for monitoring
a process (or a family of them). With the help of
this script,
we can measure the cycles per instruction (CPI) of the full_cms experiment
during its lifetime. For example:
solaris# ./x64ipc.sh ./full_cms ./bench1_10.g4
    Instructions      CPI     %CPU
        71986399     1.13    65.42
           69678     2.00     9.69
         3035697     1.22    17.47
           21070     3.13     7.21
         2479098     1.22    18.21
           21119     3.31     7.09
         1684096     1.15    18.34
           21170     3.20     7.05
         1117784     1.06    18.38
^C
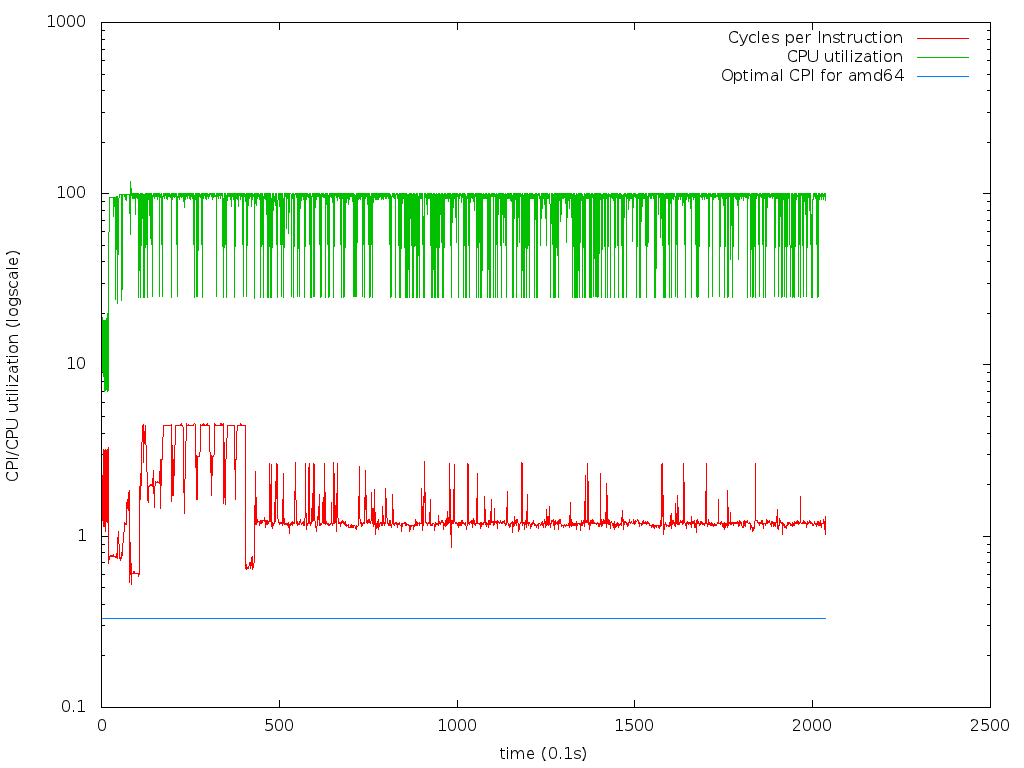
A file with the full results from a complete simulation of the bench1_100.g4 may be found
here. The data can be then plotted
with this script, and the output image looks like this.
Putting it all together:
solaris# cat /devices/pseudo/dummy@*    # to invalidate all the CPU caches
solaris# ./x64ipc.sh -q ./full_cms ./bench1_10.g4 > ./bench1_10.g4.ipc
solaris# ./cpiplot.sh ./bench1_10.g4.ipc | gnuplot > ./bench1_10.g4.ipc.png
The part of the plot where the CPI peaks is most likely contributed by the
initialization of full_cms. As we, assumingly, enter the actual simulation and
start processing events, CPI drops and stabilizes at 1.2. The plot also shows
the ideal CPI ratio for a tight cpu-bounded application, which is 0.3-4 given
that amd64 tries to execute 3 instructions per cycle.
Rule of thumb: Low CPI: we are cpu-bounded, High CPI: we are memory-bounded (cache misses?).
There is a DTrace module that allows us to access the CPU hardware counters from
within a DTrace script. We could use that to get live stack traces when the CPI
goes beyond some threshold, identifying the exact code paths that worth optimizing.
Unfortunately, in amd64 CPU architecture one cannot access more than 1 hardware counter,
and consequently cannot calculate the CPI ratio. Instead, we measure the cache misses
which are a major contributor to the CPI ratio. We do that as following:
dtrace -x ustackframes=100
       -x strsize=5000
       -n 'cpc:::PAPI_l2_dcm-all-10000 /execname == "full_cms"/ { @[ustack()] = count(); }'
       -c  "/path/to/full_cms ./bench1_10.g4" -o stack.dcm
Everytime full_cms hits 10000 L2 data cache misses, we acquire the current
userspace stack trace. We then proceed as previous to generate a
flamegraph with the greatest
offenders in terms of L2 cache misses. It is shown that approximately half of
the cache misses originate from the initialization code (GDML + xerces-c).
2.2. Caches hits and misses
2.2.1. How to plot the Data Cache (or Instruction Cache) misses
Similar to how we gather and plot CPI statistics, we can do the same with the
Data Cache misses and Instruction Cache misses. For Instruction Cache misses:
solaris# cat /devices/pseudo/dummy@*    # to invalidate all the CPU caches
solaris# ./x64l2icmisses.sh -q ./full_cms ./bench1_100.g4 > ./bench1_100.g4.ic
solaris# ./icmissesplot.sh ./bench1_100.g4.ic | gnuplot > ./bench1_100.g4.ic.png
or, for Data Cache misses:
solaris# cat /devices/pseudo/dummy@*    # to invalidate all the CPU caches
solaris# ./x64l2dcmisses.sh -q ./full_cms ./bench1_100.g4 > ./bench1_100.g4.dc
solaris# ./dcmissesplot.sh ./bench1_100.g4.dc | gnuplot > ./bench1_100.g4.dc.png
2.2.2. How to invalidate the CPU caches from userland
In order for our measurements to be unbiased we need to flush the CPU caches
everytime we start a new profiling cycle. Otherwise, we may get an artificially
improved hits/miss ratio. There is an instruction, wbinvd, (write back and
invalidate cache), that flushes both the L1 (internal) and L2 (external) caches,
but requires to be called from kernel context. DTrace cannot be used here, since
it was designed to disallow arbitrary code execution in kernel, whereas SystemTap
is more liberal in nature and may be an option in Linux systems.
cc -D_KERNEL -m64 -xarch=sse2a -xmodel=kernel -c dummy.c        # it needs the sunstudio compiler
/usr/ccs/bin/ld -r -o dummy dummy.o                             # gcc from pkg repo is 32 bits

cp dummy /tmp/dummy
cp dummy.conf /usr/kernel/drv
ln -s /tmp/dummy /usr/kernel/drv/amd64/dummy

add_drv dummy
cat /devices/pseudo/dummy@*
How to make sure that the wbinvd instruction has not been optimized out for whatever reason:
solaris# objdump -d /tmp/dummy| /usr/gnu/bin/grep -C5 wbinvd
0000000000000330 <dummy_open>:
 330:   55                      push   %rbp
 331:   48 8b ec                mov    %rsp,%rbp
 334:   48 83 ec 10             sub    $0x10,%rsp
 338:   eb 00                   jmp    33a <dummy_open+0xa>
 33a:   0f 09                   wbinvd
 33c:   33 c0                   xor    %eax,%eax
 33e:   89 45 fc                mov    %eax,-0x4(%rbp)
 341:   eb 00                   jmp    343 <dummy_open+0x13>
 343:   48 8d 45 fc             lea    -0x4(%rbp),%rax
 347:   8b 00                   mov    (%rax),%eax
solaris#
2.2.3. How to invalidate caches from within a DTrace script
There were some concerns whether the combination of the cpc provider and the
flamegraph approach for visualizing the CPU cache misses was valid. I.e.,
whether functions appearing to be causing many cache misses, were indeed
causing many cache misses.
To dismiss any doubts, I decided to take some random Geant4 function and make
it invalidate the CPU caches on purpose, every time it was called. I would then
regenerate the flamegraph and compare it with one from the untainted version of the
function.
The G4PropagatorInField::ComputeStep() function did not cause many (data) cache misses
(<2% of total), so it seemed like a good candidate.
The first idea was to do something like the following:
dtrace  -q -w
        -x ustackframes=100
        -x strsize=5000
        -n 'cpc:::PAPI_l2_dcm-all-10000 /execname == "full_cms"/ { @[ustack()] = count(); }
            pid$target::*G4PropagatorInField*ComputeStep*:entry { system("cat /devices/pseudo/dummy@0:0;"); }'
        -c "/home/stathis/gen-tests/geant4/geant4.9.5.p01/bin/Linux-g++/full_cms ./bench1_10.g4"
        -o stack.misses.fake
Everytime the function would get called, it would cat(1) to our specially crafted
dummy device driver and that would cause the CPU caches to get flushed. Unfortunately, all
the "cat(1)'s" occur once per switchrate, which is around 1 sec by default.
Also, the cat(1) happens in userspace when dtrace(1M) periodically claims
its buffers. Therefore this would not give valid results, since the function
call and the invalidation of CPU caches would be significantly dissociated timewise.
For the above reasons, we decided to pursue another route. DTrace has a built-in function,
named rand() that returns a pseudo-number generator. This function can be used
in constructs like this:
pid$target::*G4PropagatorInField*ComputeStep*:entry
/rand() % 101 == 0/
{
        ... do stuff ...
}
After the G4PropagatorInField::ComputeStep() function is called, DTrace
executes rand() and iff the condition rand() % 101 == 0 is met, the code
that resides inside the block is executed. Therefore the function call and rand()
call happen very close in time. What we did was to replace the "genuine" version
of rand() with another one that called wbinvd. We achieved that by
rewriting kernel instructions with live patching. The rand() function is
implemented as:
regs[rd] = (dtrace_gethrtime() * 2416 + 374441) % 1771875;
So, locating it inside dtrace_dif_subr was easy (0x1b0963 is the hex
representation of 1771875):
> dtrace_dif_subr::dis !grep -C5 0x1b0963
dtrace_dif_subr+0x25a9:         jmp    +0x32    <dtrace_dif_subr+0x25dd>
dtrace_dif_subr+0x25ab:         call   +0x3844030       <dtrace_gethrtime>
dtrace_dif_subr+0x25b0:         imulq  $0x970,%rax,%rax
dtrace_dif_subr+0x25b7:         addq   $0x5b6a9,%rax
dtrace_dif_subr+0x25bd:         js     +0x8     <dtrace_dif_subr+0x25c7>
dtrace_dif_subr+0x25bf:         cmpq   $0x1b0963,%rax
dtrace_dif_subr+0x25c5:         jl     +0xf     <dtrace_dif_subr+0x25d6>
dtrace_dif_subr+0x25c7:         cqtd
dtrace_dif_subr+0x25c9:         movq   $0x1b0963,%rcx
dtrace_dif_subr+0x25d0:         idivq  %rcx
dtrace_dif_subr+0x25d3:         movq   %rdx,%rax
dtrace_dif_subr+0x25d6:         movl   %r12d,%ecx
dtrace_dif_subr+0x25d9:         movq   %rax,(%rbx,%rcx,8)
dtrace_dif_subr+0x25dd:         addq   $0xc8,%rsp
>
We then replaced the idivq instruction, which occupied 3 bytes,
with a nop (90) and wbinvd (0F 09):
> dtrace_dif_subr+0x25d0/v 0x90
> dtrace_dif_subr+0x25d1/v 0x0F
> dtrace_dif_subr+0x25d2/v 0x09
>
We disassembled the result, just to make sure that everything
went as planned:
> dtrace_dif_subr+0x25d0::dis
> dtrace_dif_subr+0x25c9:         movq   $0x1b0963,%rcx
> dtrace_dif_subr+0x25d0:         nop
> dtrace_dif_subr+0x25d1:         wbinvd
> dtrace_dif_subr+0x25d3:         movq   %rdx,%rax
>
To summarize, the reasons why we chose to hack rand() are:
Finally, we ran the profiling as previously:
dtrace  -q
        -w
        -x ustackframes=100
        -x strsize=5000
        -n 'cpc:::PAPI_l2_dcm-all-10000 /execname == "full_cms"/ { @[ustack()] = count(); }
            pid$target::*G4PropagatorInField*ComputeStep*:entry/rand()%101 == 0/ {}'
        -c "/home/stathis/gen-tests/geant4/geant4.9.5.p01/bin/Linux-g++/full_cms ./bench1_10.g4"
        -o stack.misses.fake
We subsequently regenerated the flamegraph and confirmed that DTrace
identified the increase in the CPU cache misses. Here is the graph with
the unaltered ComputeStep
function and this is the regenerated graph with the altered function.
Special thanks to Sean Silva for his insights.
2.3. Outliers in graphs of hardware CPU counters
It has been brought to our attention that the graphs for CPI, DC/IC misses, etc
had lots of outliers. We hypothesized that this could be an artifact imposed
by the scheduler and/or other actions of the host operating system. For this
reason we made the full_cms bind to a specific cpu (other than #0) during
its lifetime. The command that we used was pbind(1M) in Solaris. After that
the vast majority of the outliers has been disappeared.
2.4. Why, in the flame/leaf-graphs, are functions appearing to be called by others, whereas there is no such direct call in the source code
This is an artifact caused by a compiler optimization, known as tail-call elimination or
tail-call optimization. This type of optimization (which happens by default in g++ at
the -O2 optimization level), happens when a function A() calls function C() as its
last action. E.g.
int A()
{
    B();
    return C();
}
In that case, the generated code is not this (pseudo-assembly):
The benefit, in terms of performance, is that we don’t setup a new
stack trace for the function that is about to be called. The drawback is
that we lose potentially useful information for debugging and profiling.
A typical example can be found in the ProcessOneEvent() function. In the
source code there exists this sequence of function calls:
DoEventLoop() → ProcessOneEvent() → DoProcessing() → …
In the generated leafgraphs though, DoProcessing() appears to be a direct
descendant node of DoEventLoop(), with ProcessOneEvent() not appearing at
all. In the disassembled code:
> $G
C++ symbol demangling enabled
> _ZN14G4EventManager15ProcessOneEventEP7G4Event::dis
G4EventManager::ProcessOneEvent:subl   $0xc,%esp
G4EventManager::ProcessOneEvent+3:      movl   0x10(%esp),%eax
G4EventManager::ProcessOneEvent+7:      movl   $0x0,0x10(%eax)
G4EventManager::ProcessOneEvent+0xe:    addl   $0xc,%esp
G4EventManager::ProcessOneEvent+0x11:   jmp    -0x11f6
>
As we can see, instead of a call/ret to G4EventManager::DoProcessing() there
is instead a jmp instruction. Which is the reason why DTrace appears to be missing
the ProcessOneEvent() (since its stack-frame is being taken by DoProcessing().
2.4.1. How to measure time spent in ProcessOneEvent()
In continuation of the above, in order to precisely measure the time spent in
ProcessOneEvent(), we need to follow the execution to DoProcessing() and
find the address where it ret'urns. We do so by disassemblying DoProcessing().
We then supply that address as the return point to DTrace, which can probe arbitrary
addresses, as shown below:
dtrace -n '
BEGIN
{
        evtcnt = 0;
}

pid$target::_ZN14G4EventManager15ProcessOneEventEP7G4Event:entry
{
        self->pstart = vtimestamp;
}

pid$target::-:8c8fbcf
/self->pstart/
{
        t = vtimestamp - self->pstart;
        printf("evtcnt=%d t=%d\n", ++evtcnt, t);
        self->pstart = 0;
}' -c '/home/stathis/gen-tests/geant4/geant4.9.5.p01-default/bin/Linux-g++/full_cms ./bench1_10.g4' -o poe.out